<< Thanksgiving Day report
>> Cyber Monday report
Black Friday online sales reached $7.4B. That's a 19% increase from last year. Our retail customer traffic increased 43% between Thanksgiving and Black Friday.
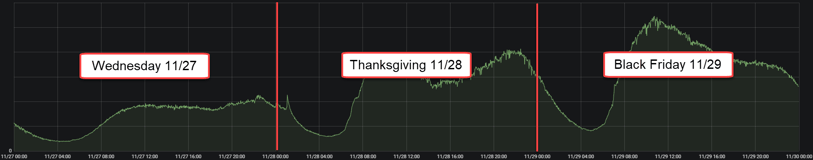
Blue Triangle retail customer traffic: 11/27 – 11/29
Many of the best deals started on Thanksgiving Day, and this year some retailers experienced issues with site availability and performance. Costco and Nordstrom Rack experienced outages Thanksgiving Day, and Target and BJ's slowed down. Black Friday was no different.
The top 500 eCommerce sites slowed 15% between Thanksgiving Day and Black Friday 2019. Costco's site continued to experience intermittent issues, and shoppers reported problems checking out on the Foot Locker site soon after they released the highly anticipated Yeezy Boost 350 V2 shoe. My colleague calls this phenomenon The Curse of Ye.
Methodology
This year we are focusing on two critical web performance metrics - Time to Interactive and Page Load Time. These metrics are highly correlated with buying behavior.
Time to Interactive
The amount of time it takes for the web page to become fully interactive. This is a Google Lighthouse metric, and is weighted heavily in Google's PageSpeed Score (v5) calculation.
Page Load Time
The amount of time required for the server to load the page completely, including content, images, JavaScript, CSS, and other external files.
Speed matters, especially on Black Friday. Below we see in Blue Triangle how conversion rate drops as users experience a slower and slower page load time.
The below report is based on Home Page measurements run by Blue Triangle's Synthetic Monitoring, taken from 5 US locations.
Leading Retailers
Time to Interactive (sec)
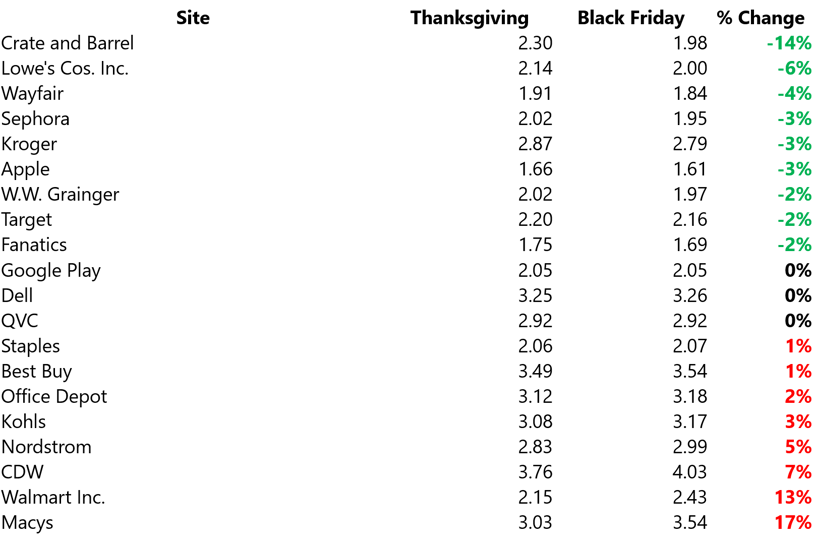
Page Load Time (sec)

The Fastest Digital Commerce 360 Top 500 Retailers
Time to Interactive (sec)

Page Load Time (sec)

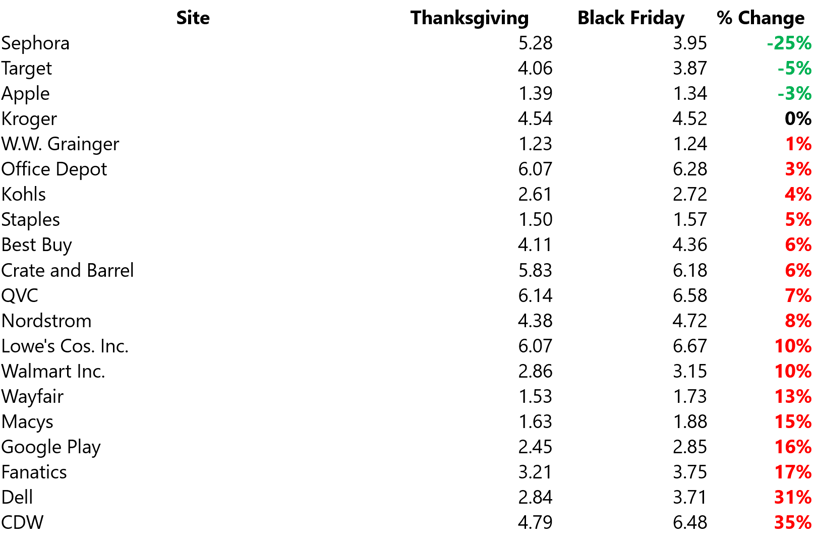
The Slowest Digital Commerce 360 Top 500 Retailers
Time to Interactive (sec)

Page Load Time (sec)

Key takeaways
- Blue Triangle’s retail customer traffic increased 43% between Thanksgiving Day and Black Friday.
- The Digital Commerce 360 Top 500 websites slowed down 15%, on average between Thanksgiving Day and Black Friday.
- Major retailers Dell and CDW slowed down on Black Friday, compared to Thanksgiving Day. Dell slowed 31%, and CDW slowed 35%.
See where the top US retailers stack up weekly: Access the Retail US Benchmarks
Have any questions or comments? Send me an email: josh@bluetriangle.com
<< Thanksgiving Day report
>> Cyber Monday report

During the holiday rush, every shopper matters
Optimize the customer journey before the eCommerce event of the year.