Google is continually adding and changing metrics to better grasp web performance and how performance affects the individual experience. At times metrics have been retired, or weights have changed, which is always a challenge for web teams to adapt. The latest metrics are a bit different from those of the past. Google's Core Web Vitals (CWV) are an essential step into understanding critical aspects of the user experience. Core Web Vitals track how users experience your site, which translates to how they feel about your product and brand. That is what makes these metrics different. CWV can be tied to business KPI's, that we can trace through Google's research.
Google's announced Core Web Vitals will roll out in May 2021. Blue Triangle has been using this time to develop some new tools to measure and track these metrics. We have consulted with Google to make sure we got it right.
In this article, we share what we have learned working with Google and integrating these new metrics. We will explain how and why these metrics are so different from previous metrics. Most importantly, we will discuss how they affect your site and what you can do in the next six months to prepare.
What are they?
Core Web Vitals focus on a users' experience. Yes, we keep saying that, so let's get into what that means. There are three main areas of focus: time to load or LCP (Largest Contentful Paint), interactivity or FID (First Input Delay), and visual stability or CLS (Cumulative Layout Shift). Together these metrics paint the picture of a user arriving at your site, waiting for content, and then the time at which they can interact with that content. Sounds completely user-centric, right? It is, so let's break these down.
LCP (Largest Contentful Paint) is the time it takes to render the largest image or text block visible within the viewport. Anything outside the viewport does not count towards LCP, and if an element is only partially in the viewport, only the visible portion of the element will contribute towards LCP.
But wait, we've got Onload and First Contentful Paint? Well, now you have LCP, and aren't you lucky? Google found the sweet spot that your users want to experience the LCP, which is within the first 2.5 seconds of a page load: Take the largest visible item on your page, and if it requires more than 2.5 seconds to render, you will want to improve this metric. That's the 75% sweet spot, but it is important because your users don't want to wait for the hero image or that Instagram video – they want to get what they need and go. And Google has given you the gift of knowing when to start and stop the observation of that measure.
FID (First Input Delay) measures the time it takes from user interaction to when the browser begins processing the event. To provide a good user experience, the FID should be less than 100ms. The idea here is that when you click a link or a button, a timer starts, and once the event for that link or button kicks off, the timer stops. It is a very short stopwatch, or it should be, but that's what Google is looking for. In other words, it is the delay it takes to kick off the first input interaction. Google wants to prevent poor user experiences like rage clicking. Long running JavaScript is the most likely cause of this frustration.
CLS (Cumulative Layout Shift) is unique among all other scores because it is the only metric not measured by time. Instead, CLS measures how much the content unexpectedly shifts during page load. For example, trying to read an article while a dynamic ad loads and shifts the text, that's Cumulative Layout Shift. Any visible elements that change their start position within the viewport are considered unstable elements. Google looks for visual stability within mobile and desktop pages.
The math for scoring CLS gets a little tricky. Google calculates the layout shift score using the impact fraction and a distance fraction. The impact fraction compares shifts between frames to calculate impact, while the distance fraction measures the distance these unstable elements move. The lower the CLS score, the more stable your layout is. Official CLS scores used by Google's performance tools are as follows: Good – CLS below 0.1, Needs improvement – CLS between 0.1 and 0.25, Poor – CLS above 0.25. Google recommends that you keep your CLS score under 0.1.
The key takeaway is that sites need to avoid unstable elements. These elements affect visual stability and, more importantly, frustrate users trying to interact with your site.
Why should I care?
The Core Web Vitals are heavily weighted within your total Google scores. CWV measure user experience. That is why these metrics are essential.
The three new metrics represent how fast a page loads and renders in your browser, how quickly the user can interact with the page during the loading process, and how the web page shifts content layout as the webpage loads. For users who have made it to your site, these metrics impact their user experience and directly impact that traffic's business benefit by potentially lowering conversion rates and average order value if the web vital metrics are poor.
As we have been saying, these metrics affect KPI's. Blue Triangle takes web vitals a step further by automatically correlating and quantifying these metrics' impact to users on your site. We analyze how these metrics impact the decision to buy, as well as how they affect KPI's like:
- Conversion Rates (CR)
- Pages Per Session (PPS)
- Average Order Value (AOV)
- Bounce Rates
- Exit Rates How do I measure?
There are many tools to track your Core Web Vitals, depending on how you want to view and use these metrics. Google separates how to measure these into two categories: lab vs. field. Lab means simulated or synthetic measurements, while in the field refers to Real User Monitoring (RUM). Google Lighthouse is a lab tool, so FID is something Lighthouse cannot track, but Page Speed Insights, Search Console, and web.dev can track all the new Core Web Vitals.
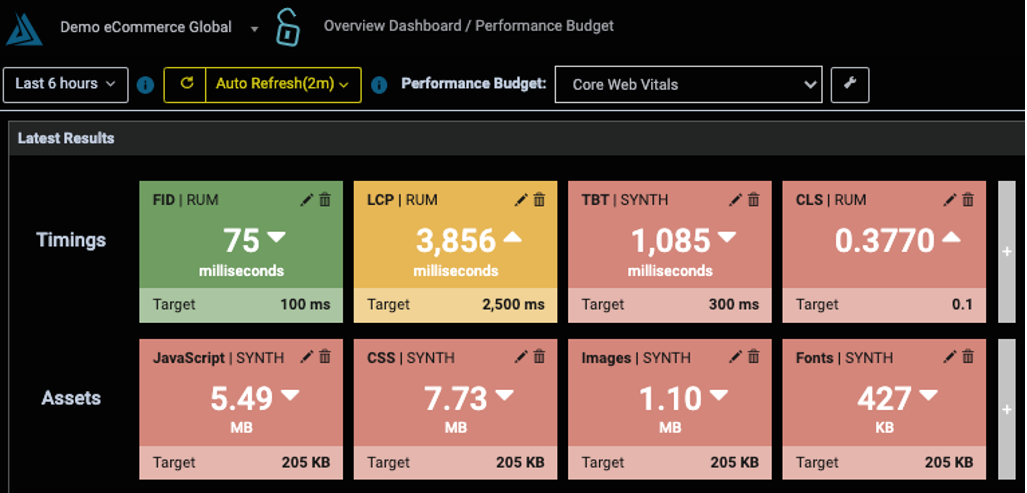
In working with Google, Blue Triangle developed Performance Budget dashboards as a quick way to track Core Web Vitals. Below is an example of Blue Triangle's Performance budget dashboard. Quickly scanning the screen, users can immediately see what is and isn't meeting the allotted budgets with the red, yellow, and green cards. FID is meeting its target of under 100ms, while TBT and CLS are over their targets. LCP is in yellow to show that it's not necessarily ideal, but it has not breached the threshold we've set for failure.
Blue Triangle uses Synthetics to track Core Web Vitals as well as twenty-two other performance metrics.
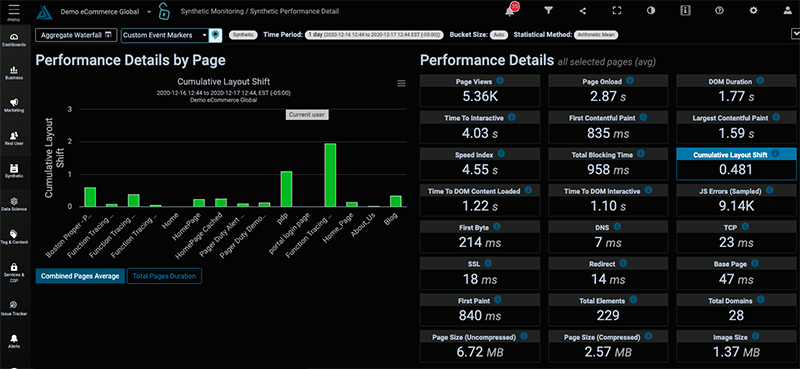
Measuring First Input Delay requires real user monitoring and cannot be measured synthetically. Total Blocking Time (TBT) offers insight into long-running threads in the JS. Additionally, we allow users to go deep into the data with our Data Science module.
If I fix these scores, will my search results improve?
Core Web Vitals are crucial, but keep in mind other metrics and factors that hinder user experience will always be important, like content context, linking, and all of the other things we did not focus on in this blog post. The takeaway is that Google is taking an innovative approach to gauging the overall user-experience and will send your site more or less traffic depending on how well your site scores with web vitals. Is your web team ready?

During the holiday rush, every shopper matters
Optimize the customer journey before the eCommerce event of the year.