How to Use the Blue Triangle Industry Benchmarks - and Why it Matters!
How to Use the Blue Triangle Industry Benchmarks – and Why it Matters!
Do you know how your website performance and Google Page Speed Score stack up against your industry? With the Blue Triangle Industry Benchmarks, you can confidently answer this question by comparing the web performance of thousands of websites. If you’ve followed our annual Cyber 5 reporting of the fastest and slowest retail websites, then you’ve already witnessed some of these capabilities in action!
The Industry Benchmarks enable you to better understand your website’s overall experience based on competitor and industry comparisons. Quickly assess a weekly snapshot of four key digital performance metrics, which include Page Load Time, Time to Interactive, and Google Page Speed Score on both Desktop and Mobile.
Page Load Time is simply the average amount of time it takes for a website page to display on the screen. On the other hand, Time to Interactive is the amount of time it takes for the webpage to become fully interactive. This is a Google Lighthouse metric and is weighed heavily in Google’s Page Speed Score calculation. Speaking of which, the Google Page Speed Score assesses how quickly it takes a website to load. In general, a score of 90 or above is ideal. On the flipside, a score of 50 or below is considered poor, and any score between 50 to 90 needs improvement.
How does your website’s digital performance benchmark against your industry and other world leading brands? To find out, simply visit the Blue Triangle Industry Benchmarks, select your vertical or search for a site, and you’ll be on your way to discovering new insights within the Industry Benchmarks!
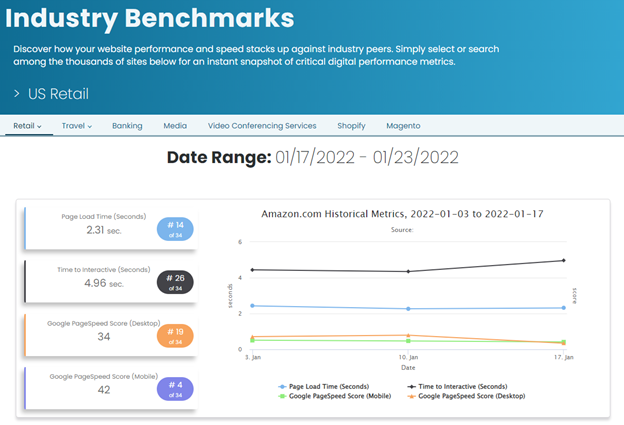
Let’s look at the recent historical measurements for one of the most popular sites today, Amazon.

Notice the weekly trended data of the previously mentioned metrics (Page Load Time, Time to Interactive, and Google Page Speed Score for both Desktop and Mobile). On the lefthand side, these measurements are also ranked among industry peers, in this example the Mass Merchant market.
Amazon’s Google Page Speed Score on Mobile is currently ranked #4 among thirty-four competitors. Who comes in at #1? Explore the Industry Benchmarks to find out!
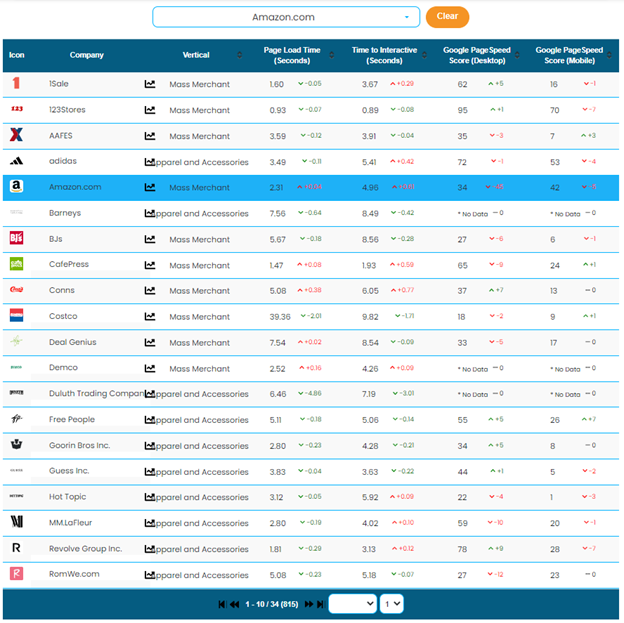
This information is also conveniently displayed in an easy-to-understand graph that can be sorted to compare industry peers, with the selected company being highlighted for reference.

Today’s leading brands need to have extensive visibility to identify and remedy why potential customers abandon their site before converting into a sale. Companies need the right tools in place, like Blue Triangle, to analyze site availability and real user behavior in order to make smarter data-driven business decisions that optimize the customers’ digital shopping experience.
Interested in seeing how your site’s – or any number of websites – performance metrics trend over time? Check out the Industry Benchmarks today for an instant snapshot!

During the holiday rush, every shopper matters
Optimize the customer journey before the eCommerce event of the year.


