Faster web performance usually translates to higher revenue. Here's an example that puts this theory to the test!
Blue Triangle found site-wide performance issues and provided speedup recommendations for one of the largest online retailers in the US. Implementing these quick fixes generated an additional $40M per month in sales for the company - nearly half a billion dollars per year just from improving speed. Big money.
Here were 2 of the major issues we found and what we recommended:
Issue 1: The western US became slower than the east
We quickly noticed that western customers were experiencing the site slower than those in the east beginning 8/18.
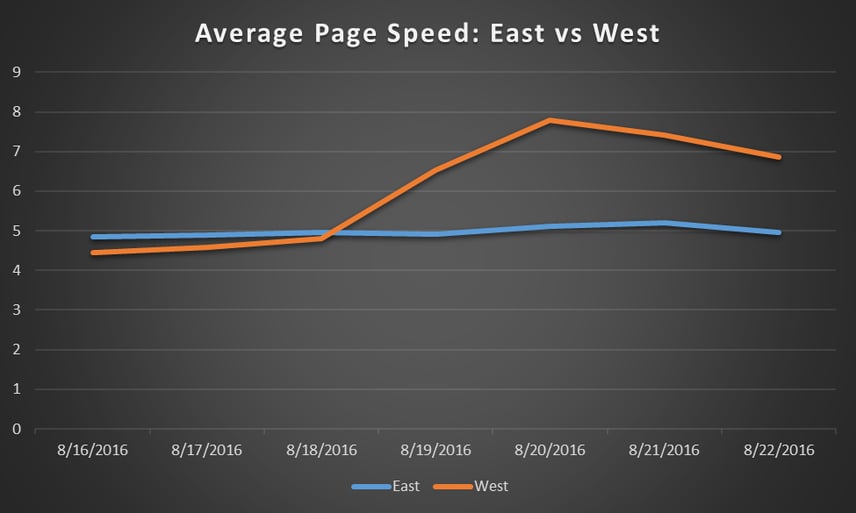
Average Eastern Region Load Time: 4.85 sec
Average Western Region Load Time: 5.72 sec
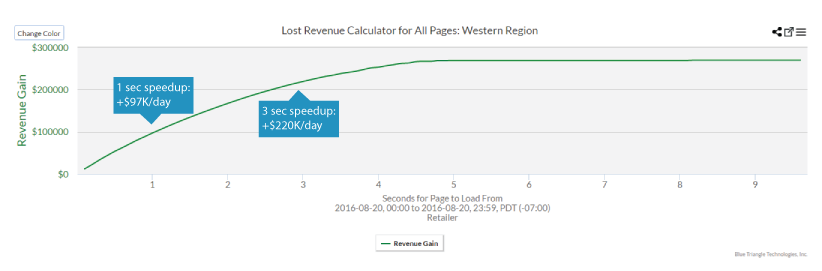
Something fishy had to be happening, and it was costing the company significantly. In fact, if the western US was as fast on Saturday 8/20 as it was two days prior, the company would have an extra $220K in their pockets.
Notice the revenue gains that could have been achieved if the site’s western region speed was faster by 1 sec, 2 sec, etc.
A large amount of traffic in the west was coming from bots
Bots visit websites of all sizes every day. Hordes of them result in more server requests per second, slowing down the experiences of human visitors.
In the case of this retailer, the slow-down was costing them between $100K and $220K every day during this week.
We recommended that they block the bot traffic immediately so they consulted with their CDN. The CDN stopped the bots at the site’s firewall and western region performance returned to normal levels. Inevitably, their revenue grew significantly from this change - as predicted by Blue Triangle.
Issue 2: Third party content slowed down the site
Third party content is generated by third party tags, which are snippets of code provided by vendors that serve many purposes on a website. For example, tags can collect important analytics data for marketing (Google Analytics) or provide the framework for customers to write product reviews (Bazaarvoice). But if they’re not managed properly, third party tags can negatively impact page performance.
This retailer was having a serious issue with third party content, particularly on their product page template. Out of the entire site, this page had the highest revenue opportunity from improving performance so we recommended that they focus there.
Below is the retailer’s third-party content ordered top-to-bottom by when they loaded in the product page. The wider the rectangle, the longer that piece of content takes to load. The content surrounded by red boxes are the worst offenders to page performance.
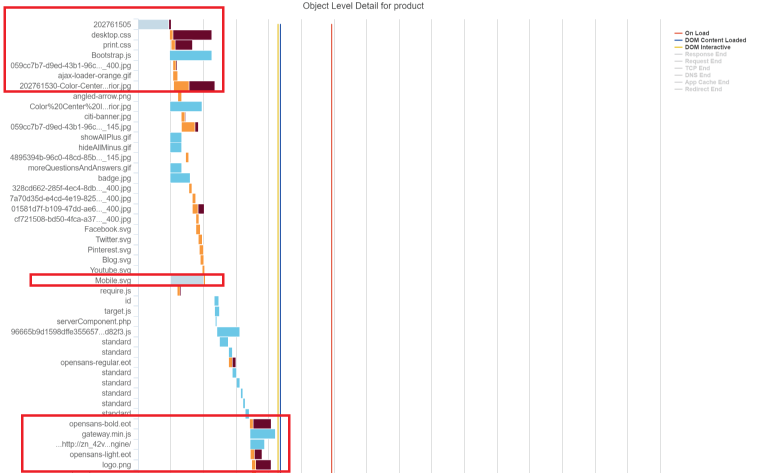
The vertical yellow line in the graph represents the DOM Interactive – the time at which users can begin interacting with the page. Tags that load before this should be vital to the page’s initial appearance. If they aren’t, the page's initial view takes longer to load than it needs to.
We provided recommendations on how to fix these performance issues in their tag manager. They implemented them and a significant portion of the $40 million/month revenue gain came from shifting and optimizing this content.
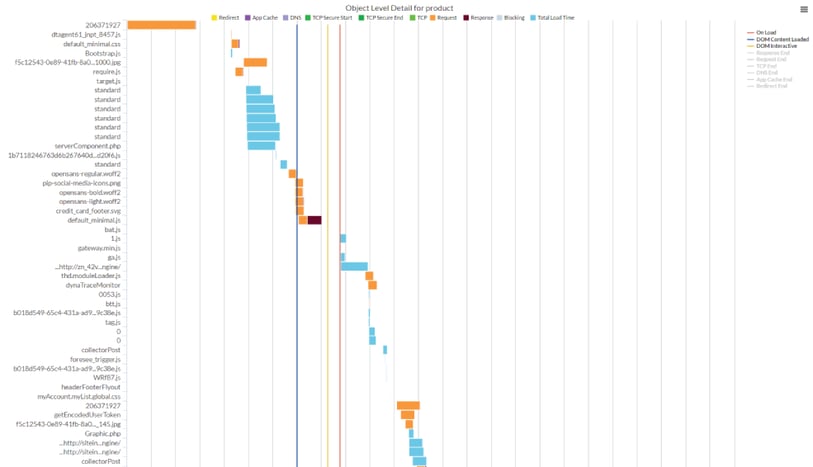
Now here’s that same page but optimized (graph showing 48 out of 132 pieces of content). Notice that the amount of content loaded before the DOM Interactive is cut in half from the previous graph.
Key Takeaways
So there you have it! Just a few simple adjustments to this retailer’s CDN configuration and tag manager resulted in annual revenue gains of around half a billion dollars. This has taught us a few things:
Monitor your site’s performance by geography.
Just like the issue with bots in the western US, there are sometimes geo-specific issues you may discover. Monitor by geography even if you have a CDN because while ideal, most CDNs are unable to deliver content equally across the world.
Know how much performance impacts your revenue.
For the sake of argument, let’s say it was going to cost this retailer $300K per day to block their bot traffic. If the slow-down was costing them between $100K and $220K per day, then it wouldn’t be worth blocking the traffic. Quantifying the impact performance changes have on revenue is vital when prioritizing, budgeting, and implementing, site changes.
Third party content can eat you alive.
Okay, maybe that’s a bit harsh. But it severely impacts page performance, customer experience, and revenue – especially if content is loaded before anyone can even interact with the page. Manage this content on a day to day basis by monitoring their individual performance by geography and device. Be sure to move all non-vital content after the DOM Interactive.
Want to find revenue on your site?

During the holiday rush, every shopper matters
Optimize the customer journey before the eCommerce event of the year.