
I admit…I wasn’t hooked on the show Mad Men when it first came out. But all my marketing friends loved it, so I caught an episode and ended up binge watching it all.
The series had many twists and turns, but it had a few consistencies from one episode to the next: rum…and scotch, vodka and whiskey, too. But hey, this blog post is about rum, so rum it is! The marketing guys and gals in the show seemed to love rum. Any time. All the time.
So we @_BlueTriangle thought, how has marketing gone without rum since the show ended? We must fix that and bring rum back to marketing.
And bring it back we did – Blue Triangle’s Marketing Analytics powered by RUM. (RUM = Real User Monitoring)
Enter Marketing Analytics. Driven by RUM.
Don Draper was adept at sensing what marketing campaigns would click for his clients, to the point of arrogance at times. (I did love the Coke ad reference that closed the show, however!)
And although he was usually right, he lacked insights into how his bevy of marketing campaigns and slogans were doing at any point in time.
Don, Blue Triangle has you covered. Behold, the Marketing Insights module in our Digital Performance Management Platform.
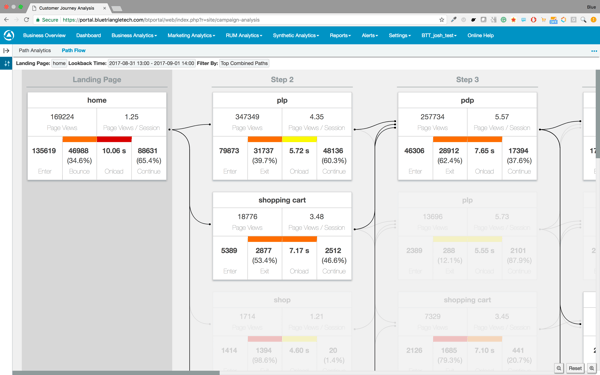
It provides our friends in marketing the entire view of the customer journey, powered by our RUM solution under the covers. This real-time capability provides data from all customer journeys, not just from marketing campaigns.
In addition to the typical metrics we see in RUM solutions (e.g. revenue, conversion rates, bounce rates), Blue Triangle provides insights that until now could only be found in a marketing analytics platform like IBM or Adobe. These include exit rates, path analytics and path flows that connect revenue performance to web performance throughout the entire customer journey.
As you can see in the screen shot below, a customer in the office supply business is running a campaign around copy paper.
>> Learn about our Real User Monitoring with your data here
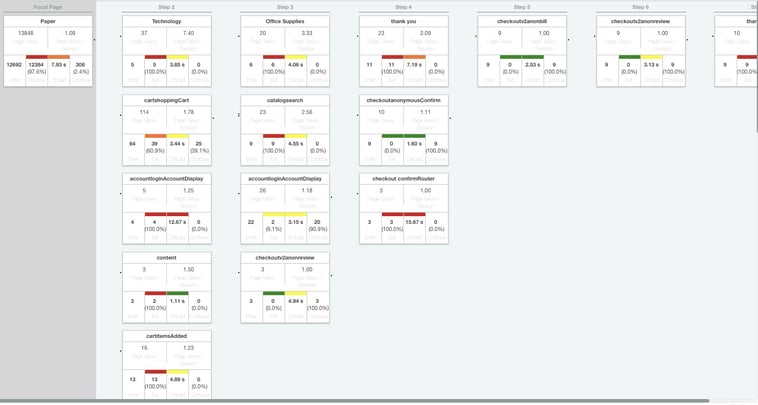
This snapshot of a “live” view shows the customer journey once someone comes to the web site starting on the “Paper” page. Whether the journey ends in an exit or a conversion, each step taken is shown in the live view, along with their web performance metrics.
Areas with high exit rates and poor page performance are easy to see and react to. How? A high exit rate coupled with a high page load time, such as Step 4, “Checkout ConfirmRouter” below, should be drilled into immediately. Whatever the issue impacting page load time is (e.g. a fat image, a new tag, 3rd party tag, etc.), it can be diagnosed—and fixed—on the fly, thus salvaging the campaign over the long haul.
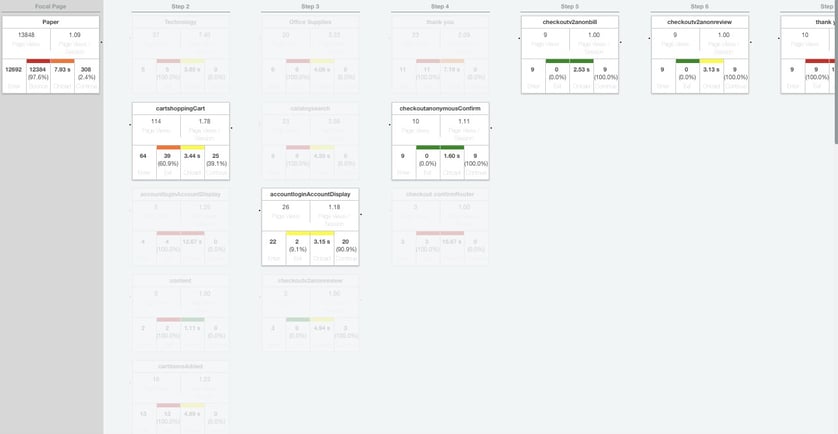
Now if I want to see/analyze the most common path to conversion, I simply would “click” on the “Thank you” box, which is the order confirmation/completion page. This would then highlight the most common customer journey path to conversion. This journey is providing me with the most revenue. Given its web performance, it’s easy to see why!
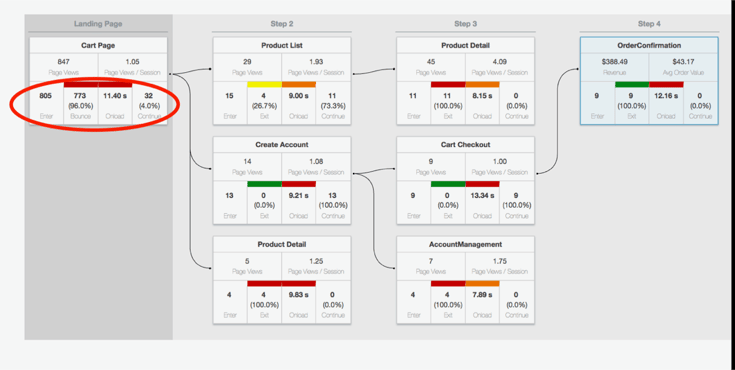
Now, let’s look at what else this data can show us. In the diagram below, we see an abnormally high exit rate at the entry page and an extremely slow page load time. When I traverse through the customer journey to the “OrderConfirmation” page, I see that the 9 people who made it this far in the slow journey all failed to execute the transaction.
What does this tell us? A lot!
Since this journey started as the result of a customer retention email about an “abandoned” shopping cart, we know that they’ve been to our site recently. We also know from our history, that this retention campaign typically has conversion rates around 40%. So for us to be at ZERO, even with poor performance, means that there is something else going on. Since not one conversion occurred, our first place to look should be, and was, the payment system backend.
So, “Voila!”, that’s exactly where the problem was! And it was caught very early in the campaign cycle - before any back-end application monitoring solutions picked up on it. And certainly well before any marketing solution noticed it. (The one in use never did pick up on it!)
The best part? The client’s marketing team saw the problem in the Blue Triangle platform and immediately notified the right team that could fix the backend payment system.
Oh yeah, and the marketing team didn’t need a team of Stanford data scientists, a web performance IT expert or a cast of consultants to help them find the issue. It was right in front of them.
Takeaway: #MarkIT – It's All About the Revenue!

The takeaway is simple.
If you are a web performance expert in IT, frame your metrics in the context of revenue. In this case, revenue attached to marketing campaigns. Marketing doesn’t understand all the “geeky” IT web performance terms, but they sure do understand revenue. In our case, RUM provides the “why” for marketing campaigns. Why are sales off? Because there’s a problem with technology. (e.g. the payment backend, 3rd party tags, heavy images, etc.)
If you are in marketing and own the bottom line for revenue, understanding the “why” factor will help you maximize your online revenue for each campaign you run.
And, if I were you, I’d want to see this in action for my eCommerce revenue stream. What have you got to lose? (Besides your revenue, of course.)

October 2017 Update
Recently I spoke about this very topic at a NY Web Performance Meet-Up. Take a look!

During the holiday rush, every shopper matters
Optimize the customer journey before the eCommerce event of the year.