
Acquiring quality traffic isn’t cheap or easy. For all your effort, you can’t afford to give these visitors a reason to leave. The customers headed for your exit will simply seek out same or similar products elsewhere, making your site a significant demand-driver for your competitors’ sites.
If you are a stakeholder in your company’s site performance, it’s essential to focus on the 5 most common reasons why people leave your site without purchasing. Remediating this visitor churn will improve your acquisition and retention efforts.
5 Reasons Why People Leave
For a quick review, the 5 reasons visitors leave a site without buying/converting are:
- Performance (the content looks fabulous, but it’s taking too long to load)
- Content (the images are blurry, a product description isn’t complete, or there’s an incorrect price)
- Functionality (adding to the cart isn’t working, or the ‘buy’ button won’t let you purchase
- Browsing (this is just the place on the site where people leave— maybe Marketing can help here with engagement)
- Customer Journey Hijacking (browser plug-ins [not your content] on the visitor’s browser are sending them to your competitors.
Shown: Red, Orange, and Yellow indicators for exit rates and performance within Blue Triangle.
If you sell direct to customers online, then there are likely many people in your org with a stake in site performance. DevOps, Digital Experience & Transformation Architects, E-commerce, and Marketing teams should be focused on where the optimization shortcomings are found, and how much money is left on the table for as long as they persist. Getting optimized means keeping teams informed on key performance data - even when you can’t have staff leaned-in 24/7.
Shown: Opportunities for optimization are revealed and prioritized within Blue Triangle’s Real-Time Customer Journey Analysis by Campaign, Path Analysis, and Path Flow.
Visitor Expectations
You’ve probably seen the statistics from KISS Metrics, Google, and others:
- Nearly half of all online consumers expect a web page to load in 2 seconds or less, and when it takes longer than 3 seconds, 40% leave.
- 79% of shoppers dissatisfied with slow websites are less likely to buy from the site again while 64% would simply purchase from a competitor.
Your main site must also perform for mobile visitors.
- Google says 61% of mobile visitors won’t return to your site if they have a frustrating experience, and 40% will then go to a competitor.
The impact of site performance shortcomings is immediate and destroys value at scale. Those customers most eager to transact are likely to be the first to go— and a cohort between 40-64% of these high-value visitors are leaving for your competitor within seconds of their disappointment. The time-to-departure for these visitors may vary between B2B and B2C sites, but the 15 Second Rule remains a good rule-of-thumb. When you have 15 seconds to work with, there is literally no time to waste. Seeing how much revenue loss is represented by these defections can be eye-watering, but quantifying actual revenue loss is the first step in your turnaround.
Shown: A Real-Time Customer Journey Analysis within Blue Triangle uncovering that 2.5 seconds of total blocking time is causing many visitors to exit the site without purchasing.
Quantifying the Revenue Value of All Pages
If you’re only using enterprise web analytics, then what you have looks more like abandonment rate analysis than a comprehensive revenue loss analysis because it only assigns a conversion rate to a single page (i.e. your Thank You Page).
You need to know the impact that all pages have on revenue to scale your optimization program appropriately. This is where a proper revenue opportunity-by-page analysis is needed in order to understand the true value of how your pages, code, and content all contribute to revenue, both individually and in symphony with one another.
Shown: Blue Triangle’s Digital Experience Management Platform showing a Mobile Revenue Opportunity of $1.5M over 30 Days broken out by page.
The reality is that your product detail pages, product listing pages, search component, cart pages, and Thank You Pages all have a specific value in the purchase process, and are best assigned proper attribution by revenue opportunity. Doing this, you can then prioritize opportunities by the amount of total impact they have on your business. Once you’re able to accurately attribute revenue opportunity to multiple pages in a purchase cycle, you can then begin the process of identifying and overlaying which of the 5 reasons visitors aren’t purchasing to prioritize.
Shown: Type Errors are often responsible for loss of site functionality such as the Purchase Button or Add To Cart Button not working as expected. Site functionality is one of the 5 main reasons why visitors leave your site without converting.
Wherever you currently sit in your organization, it likely makes sense to start this learning process with the help of your analytics teams. Getting a correct description of your problems is where things start, but understanding why you are having these problems is likely a multi-disciplinary project. To analyze your conversion rate and abandonment rate by the impact of campaign, pages, path, JavaScript code, images, tags, and all of your performance metrics (i.e. Total Blocking Time, Time To Interactive, First Contentful Paint, Cumulative Layout Shift, etc.) will benefit from widening the scope of expertise of analytics and data science professionals leaning-in.
Your multi-disciplinary team can also greatly help in properly assigning the revenue opportunity of each of these data dimensions, and the project will benefit from a consensus approach to the proper attribution of that revenue according to how visitors convert on your site. This becomes complicated once you begin mixing and matching attributes because optimization is neither linear nor cumulative, and having other stakeholders in the mix is advised.
Shown: Blue Triangle’s DEM Platform allows you to immediately find out how much revenue opportunity there is by improving any specific performance metric, or simply by speeding up any given page.
In this paradigm, you have migrated from a simple enterprise web analytics approach (which focuses on a handful of key pages) to a holistic approach which optimizes the role of each page in driving or losing transaction value. Traditional enterprise web analytics solutions simply don’t know the impact of conversions on non-conversion pages. They can only give you a flat number (of how many people didn’t convert) without telling you why. But knowing why will require more than calculating the conversion rate on only 1 converting page (the transaction page). Getting an answer to “why” may start out as reactive, but the greatest value generation is a product of preparation and foreknowledge of your site issues. The good news is, the same paradigm you can use to solve these immediate problems can fuel revenue optimization at scale.
How to know the outcomes of site optimization projects before you begin
Life’s great when you’re making your KPI goals. As the old saying goes, revenue solves all problems. Your boss loves you, your boss’s boss loves you. Maybe you even get a bonus. Well done. But the second you aren’t making your conversion numbers, and conversions are below expectations— it will be all eyes on you.
You need to know why conversions are lower than expected and you’ll need to make adjustments in real-time, even as campaigns are launched. You also should be able to quickly prioritize each correction by opportunity revenue when multiple optimizations need to be made. You simply need to know which opportunity is worth working on first.
The second that flash sale or marketing campaign goes live, you ought to be able to measure the visitor engagement on your site, identifying any user struggle, discovering the exact reason for the struggle (down to the exact code/content/function/tag level), and then figuring out which remediation creates the most incremental revenue. It’s 2022. You now can do this, and accurately.
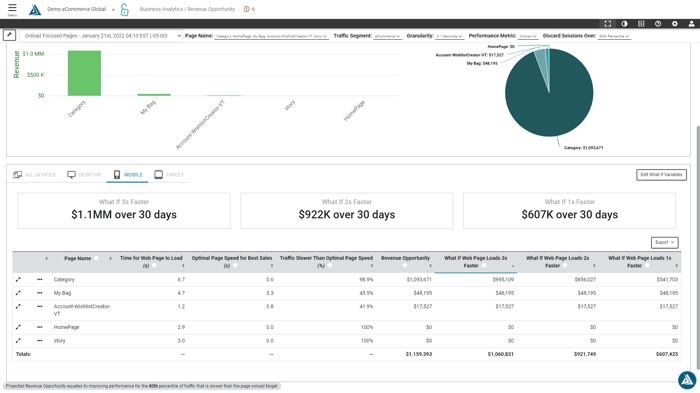
Shown: Blue Triangle’s Revenue Attribution Reporting. Improving the Category Page of this E-Commerce site by 200ms equates to $217,166. 2 seconds of improvement results in $1,054,251. Note the diminishing returns after 3 seconds of improvement, allowing you to work hard in all the right places.
Know the outcomes of site optimization projects before you begin. Can you really afford to guess at prioritization and/or work hard in all the wrong places?
Shown: Blue Triangle’s Revenue Attribution Reporting. When the page Onload is 3 seconds slower the conversion rate decreases from 9.13% to 6.7%. Blue Triangle slices by any given performance metric.
Summary:
- There are 5 different reasons why visitors are leaving your site without converting. Blue Triangle allows you to quickly identify why those visitors leave and how to remediate the issue. Each remediation is accurately mapped to a revenue opportunity. Blue Triangle also allows you to quickly and easily surface revenue opportunity in real-time by many different attributes including device, browser & OS, page, time period, marketing channel, network infrastructure, page segmentation, geography, and other custom audience attributes.
- Revealing the underlying causes for missed brand conversions is just the beginning. Blue Triangle helps you prioritize each issue by specifically identifying the impact to your business, shows you where to remediate each issue, and finally, provides you with A/B Testing to validate that each change is positively impacting your business.
- Prioritizing site optimization opportunities means that you need to not only identify each remediation by revenue opportunity, but also, at a minimum, by page and device. There are multiple pages contributing to engagement, conversion, and sales— not just one. Understanding revenue opportunity by page and device means you’ll also be able to prioritize your optimization projects with confidence.
Blue Triangle’s Digital Experience Management Platform exposes lost revenue associated with customer struggle. For every other solution the customer struggle is unknown. Blue Triangle is the only platform that solves both sides of the equation.
Experience how your life will improve for the better with Blue Triangle. Industry experts will work with you throughout each week to discover optimization opportunities, identify remediation, and A/B test site optimization related to site performance, functionality, content, and both 1st party and 3rd party code. Begin accurately revealing how much you’re leaving on the table, how to boost conversion, and reclaim lost revenue.

During the holiday rush, every shopper matters
Optimize the customer journey before the eCommerce event of the year.