
This blog post was originally published by Internet Retailer.
Faster is better, but the impact is not the same for all retailers, or the same for all pages on a retailer’s eCommerce site. It’s important to know which pages will yield better conversion rates when they load more quickly, and for which pages other considerations, such as high-quality images, may be more important than page-loading time.
In eCommerce, patience is not a virtue. Horrific customer experiences, caused by website slowdowns and outages, cost E-Retailers billions every year. This is compounded by the direction the web is heading. It’s getting harder for sites to load quickly while delivering richer, more personalized experiences. Every day, organizations are forced to balance aesthetics, usability, and functionality with web performance - and that's no easy task with limited budget and ever-increasing sales targets.
As the official source of web performance data for Internet Retailer, Blue Triangle understands that every website has its own "Performance DNA" - the level of patience its customers have. Web performance benchmarks should be used as loose guidelines, not the standard. It is imperative that each site understand its “Performance DNA” to find the perfect balance.
The data presented in this article reflects measurements taken of the Internet Retailer U.S. Top 1000 from 2/22/2019 through 2/28/2019 by Blue Triangle.
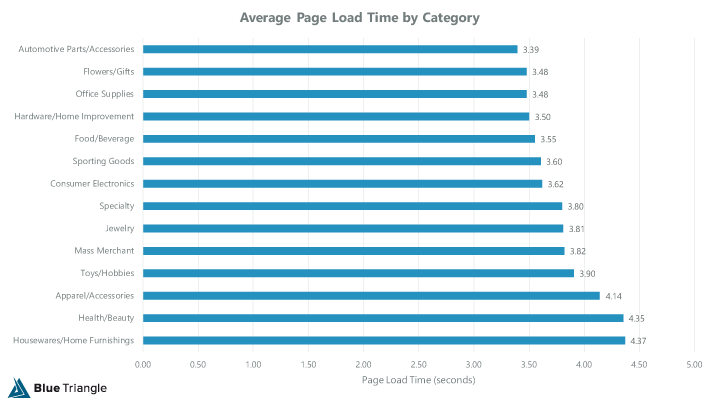
Web Performance by Merchandise Category
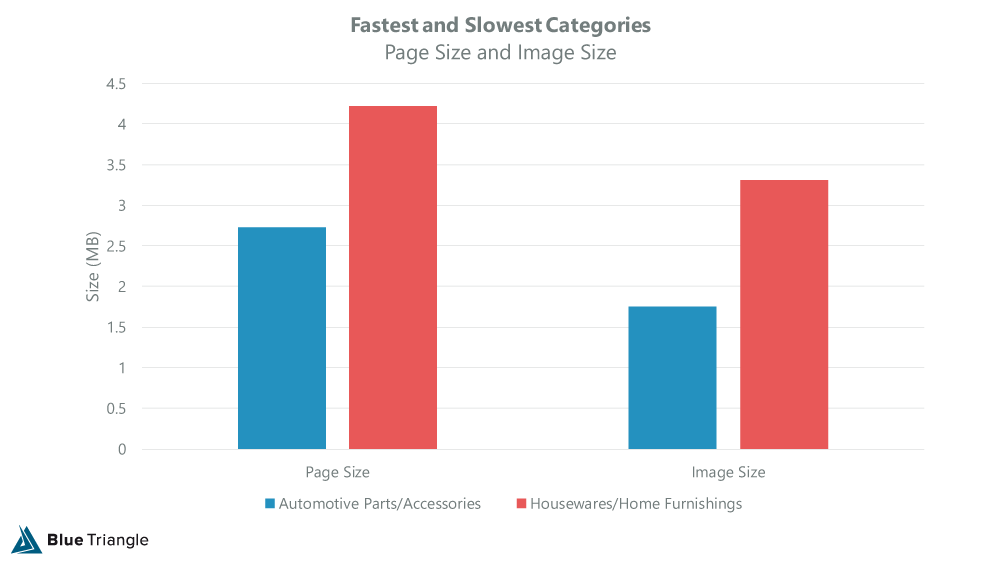
On average, home page load time across the Internet Retailer Top 1000 was 3.88 seconds. When we break this out by merchandise category, the fastest category on average was Automotive Parts/Accessories (3.39 sec across 38 websites), and the slowest was Housewares/Home Furnishings (4.37 sec across 98 websites). Perhaps nearly a single second difference between high and low seems trivial, but this very easily could equate into millions of dollars.
So what made Automotive Parts/Accessories websites faster than the others?
- 6% fewer files (158 on average) - this includes images, CSS, third-party JavaScript tags, etc.
- 28% lighter page size (2.73 MB on average)
- 41% less image size (1.75 MB on average)
Conversely, what made Housewares/Home Furnishings websites slower?
- 12% more files (185 on average)
- 20% heavier page size (4.22 MB on average)
- 16% higher image size (3.31 MB on average)
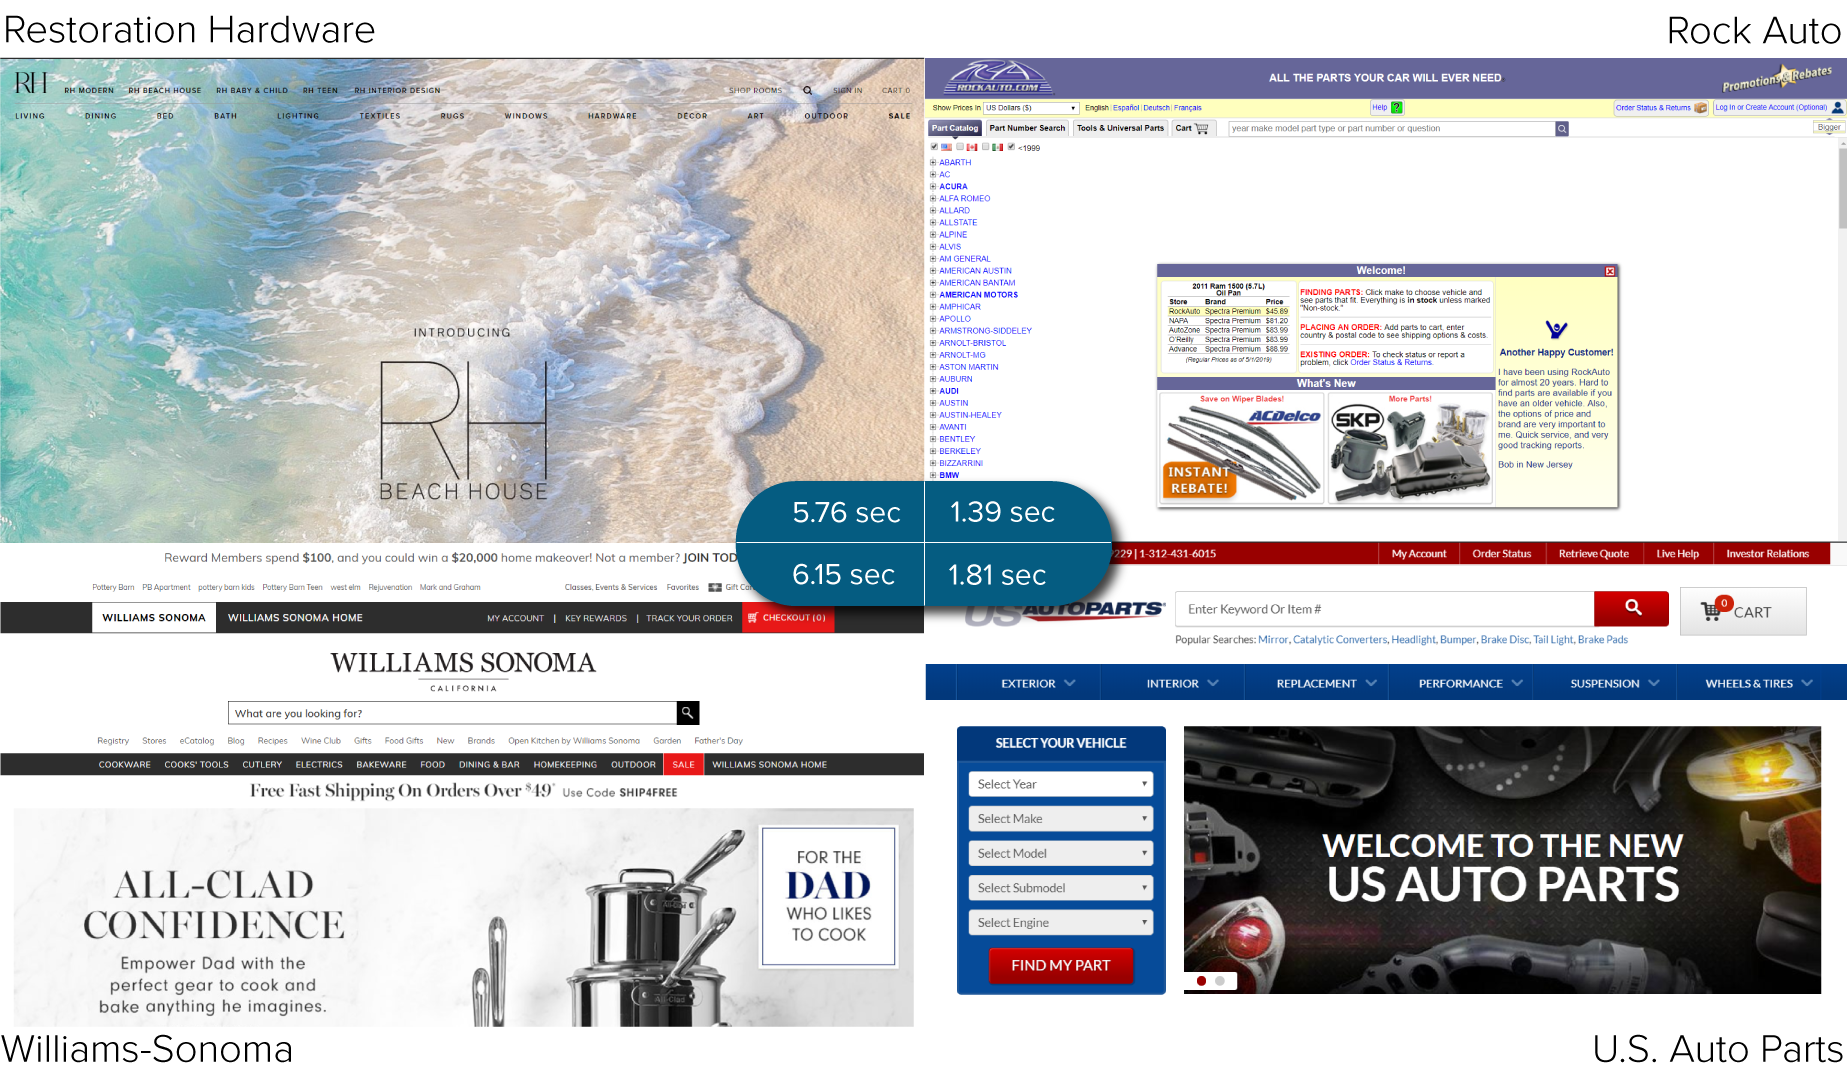
Given the amount of rich content (high-res images, offers, etc.) retailers like Williams-Sonoma (IR #32) and Restoration Hardware (IR #57) have on their websites compared to Automotive retailers like RockAuto (IR #225) and U.S Auto Parts (IR #205), it makes sense that their load times are higher. They are in industries where site visitors typically expect more visually impactful content, thus impacting page load time.
Sometimes sacrificing aesthetics for speed is worth it. But sometimes it isn't.
One of Blue Triangle's apparel customers sped up their site by compressing their images 40% - 50%, resulting in 24% higher conversion rates. But for another apparel customer, image compression caused conversion rates to drop 60% because their user-base preferred higher quality images. This goes to show that every site has its own Performance DNA.
Top 10 Retailers
Over the last few years, Blue Triangle has been tracking the performance of hundreds of US and Europe retailers week by week in our Retail Industry Benchmarks.
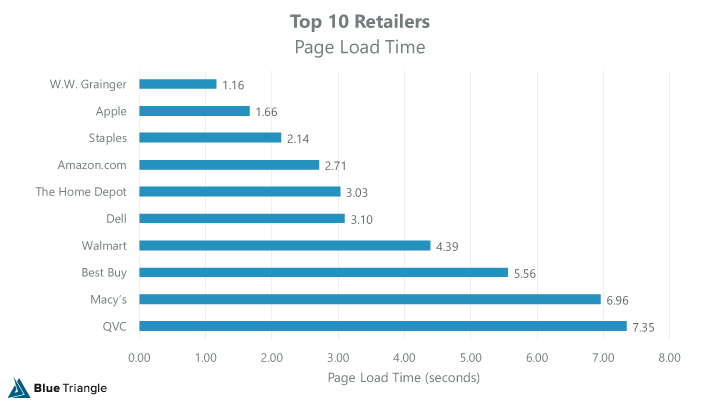
When we analyze the data in the Internet Retailer Top 1000, 4 of the Top 10 retailers loaded slower than the Top 1000 average (3.88 sec). Amazon beat out Walmart by 1.68 seconds.
But does this 1.68-second difference matter to Walmart’s revenue? The answer may be yes. The answer may be no. One thing’s for sure, knowing its Performance DNA will empower Walmart to make the right decisions around optimization.
Understanding Your Site's "Performance DNA"
Analyzing where you stack up against your competitors is helpful and interesting (especially for SEO and executive teams), but your optimizations should not be driven by this approach. Their target market, their strategies, their brand, and their experience is different than yours. So focusing on their performance means not focusing on yours.
Instead, correlate how web performance impacts your business to understand 1) how fast your site needs to be, 2) how much revenue is at stake, and 3) where you should focus first.
How fast does your site need to be?
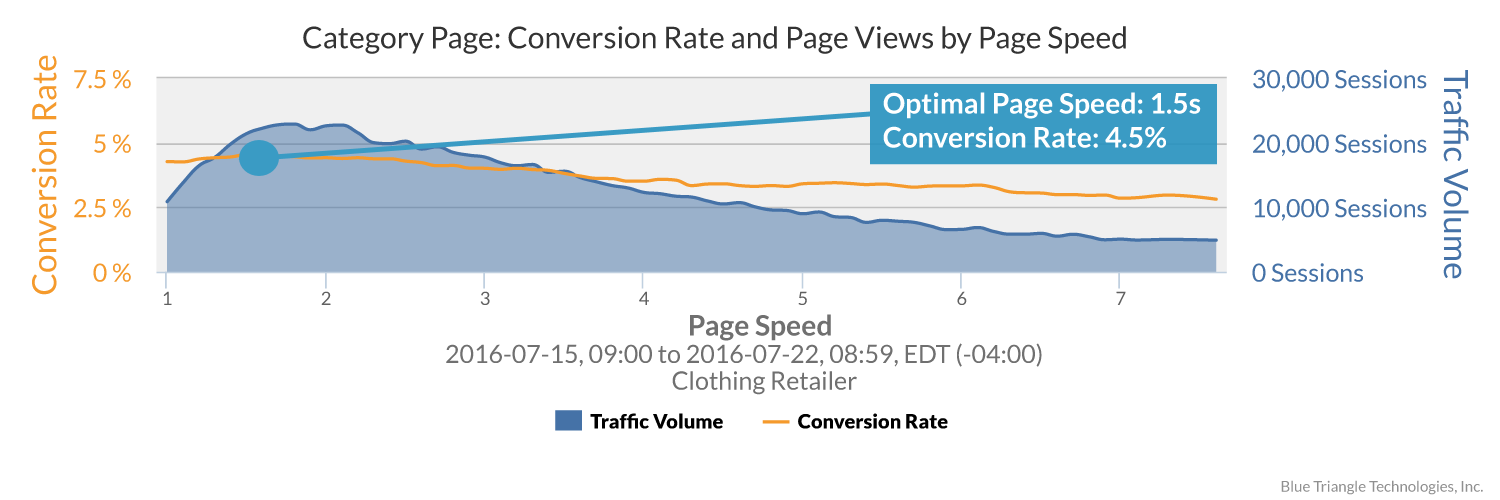
Mapping out conversion rate by page load time visualizes you how fast your site needs to be to maximize conversions. For example, from the graph below we see that for one clothing retailer, shoppers that load the Category Page in 1.5 seconds convert at the highest rate.
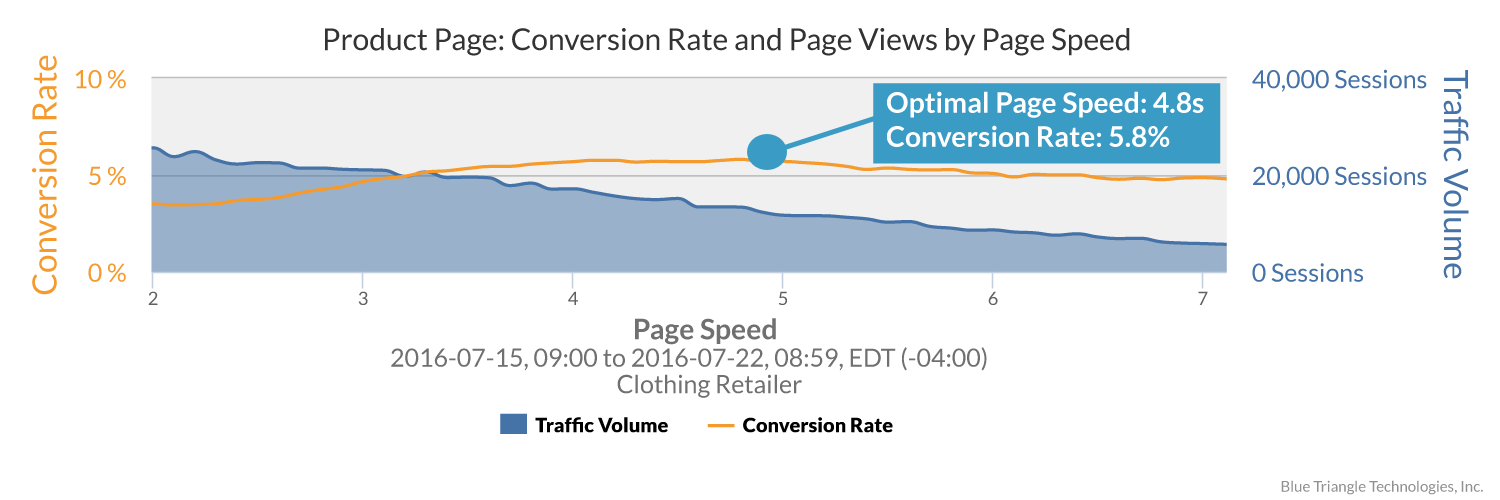
But on the Product Page for the same clothing retailer shoppers that load the page in 4.8 seconds convert at the highest rate. So if the page loaded any faster than 4.8 seconds, there would be no conversion rate impact.
How much revenue is at stake? Where should you focus?
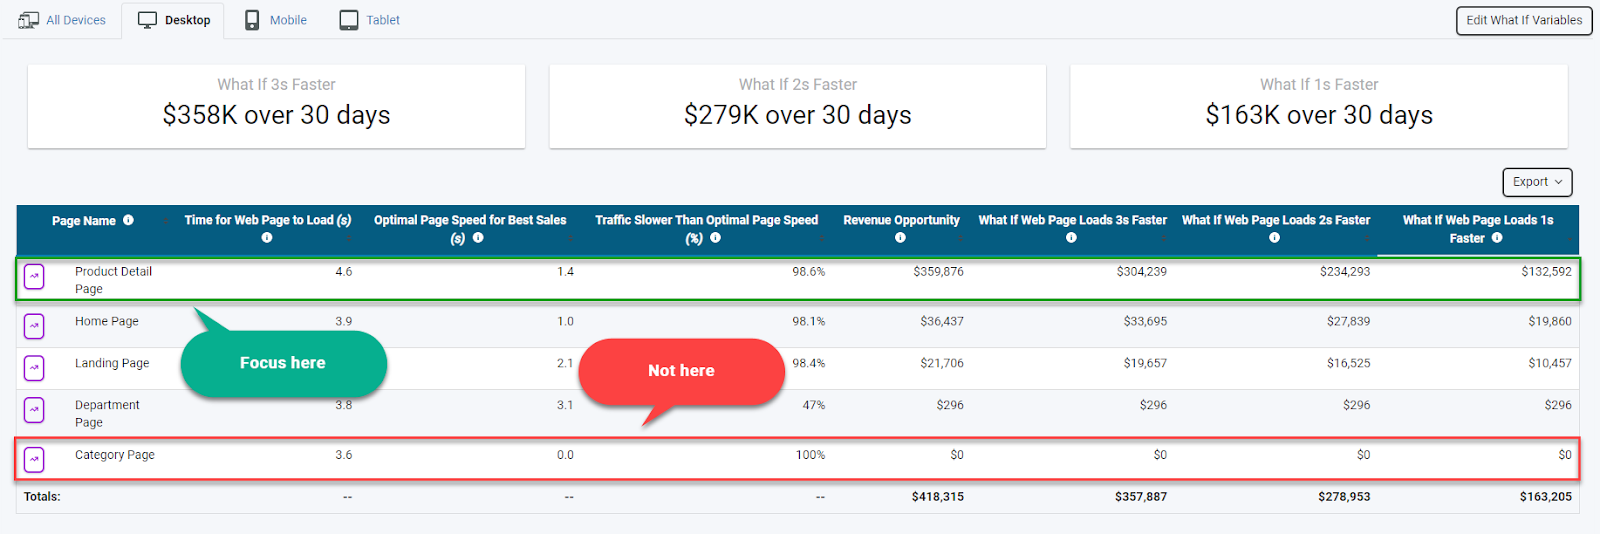
For one Apparel retailer, Blue Triangle found that speeding up the Product Detail Page by 1 second would generate $132,592 in additional revenue per week, whereas speeding up the Category Page for the same user-base would have no revenue impact. Without knowing your site’s Performance DNA, you may end up wasting time and resources addressing the wrong areas of your site.
Takeaways
- Automotive Parts/Accessories retailers had faster websites, on average. This is due to a lower file count, page size, and image size. Housewares/Home Furnishings retailers had slower websites, on average.
- Amazon beat out Walmart by 1.68 seconds.
- Tracking your performance vs competitors is helpful, but should not drive your decision-making.
- Your Performance DNA is unlike any other firm’s.
- Not all pages are created equal, therefore it is critical to understand how performance impacts revenue throughout your entire customer journey.
If understanding your Performance DNA is important to you, I invite you to meet with Blue Triangle. We're happy to benchmark your site, too!

During the holiday rush, every shopper matters
Optimize the customer journey before the eCommerce event of the year.