.jpg)
There's a shared belief among eBusinesses that web performance and revenue are somehow connected. So it comes as no surprise when more and more websites begin projects to improve speed. Unfortunately, many of these projects are based entirely on guesswork - "Let's focus on the pages with the highest traffic" or "I think the speed of our product pages cause customer abandonment".
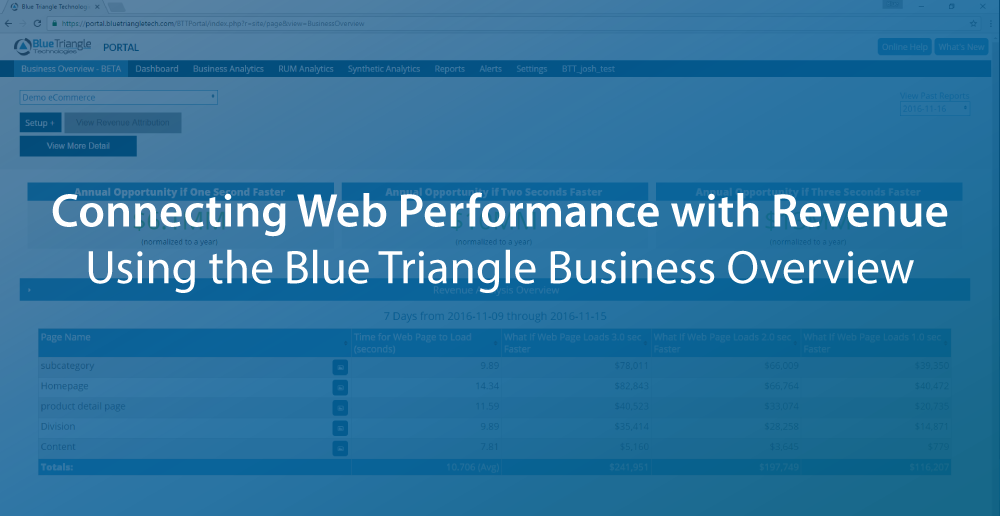
It's time that eBusinesses stop the guesswork once and for all with The Blue Triangle Business Overview.
The Blue Triangle Business Overview is a road-map for website owners to optimize their site based on revenue.
It's a one-stop shop to accurately connect web performance with revenue on every web page. We’re the only company to provide this level of business visibility into website performance.
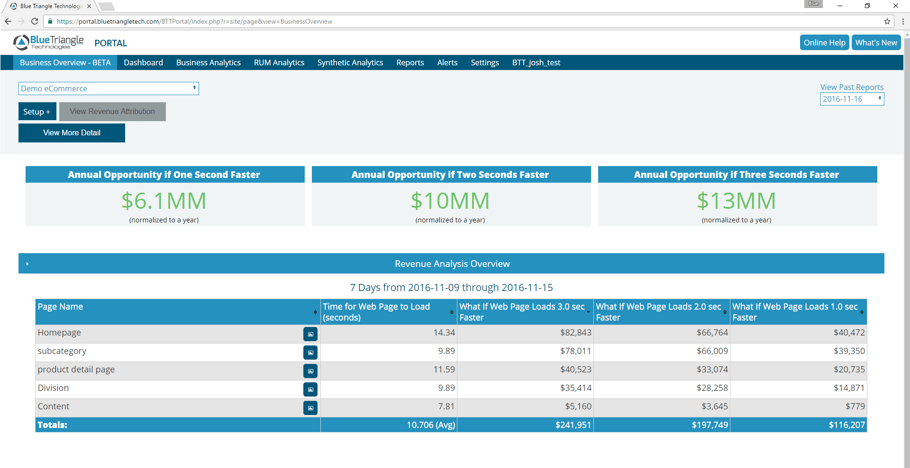
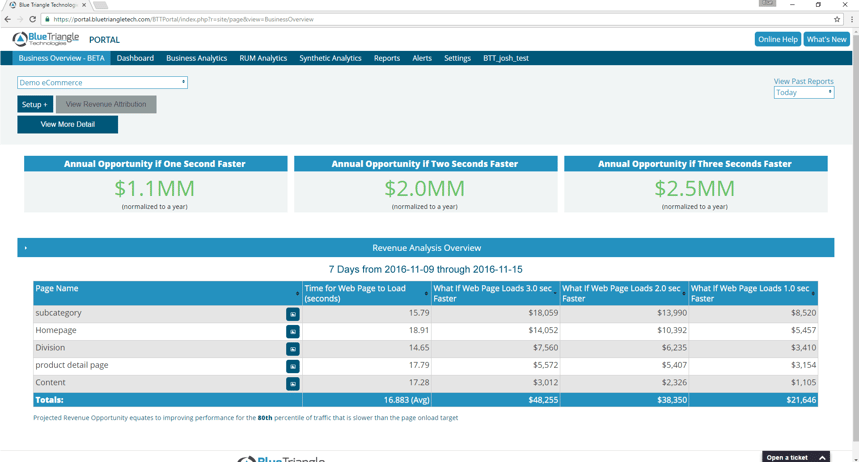
Notice the revenue gains that can be achieved if overall desktop site performance improves by 1 second, 2 seconds, and 3 seconds.
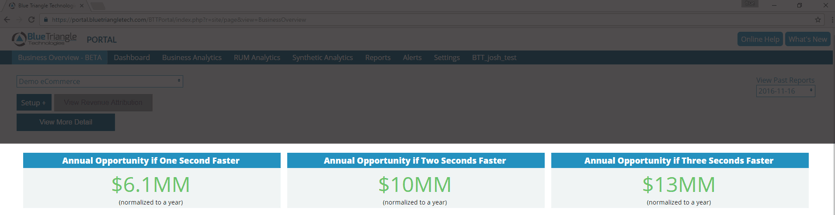
And no, these calculations aren’t voodoo! We are 85%+ accurate in our predictions. Stay tuned to read how this analysis works.
This information is displayed page-by-page so optimization teams can prioritize where focus first.
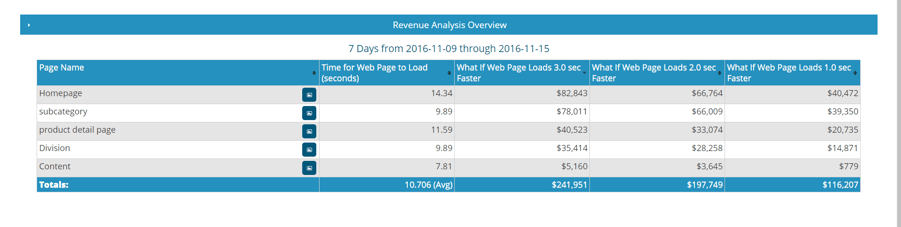
For this customer, they can achieve the highest revenue gains in the shortest amount of time if they speed up their Home Page first, followed by their Subcategory and Product Detail pages.
Click into one of the pages to visualize how speed impacts conversion rates, revenue per customer, and pages per session.
The X-Axis is page speed and the blue shaded portion is the amount of traffic for every page speed increment on the graph.
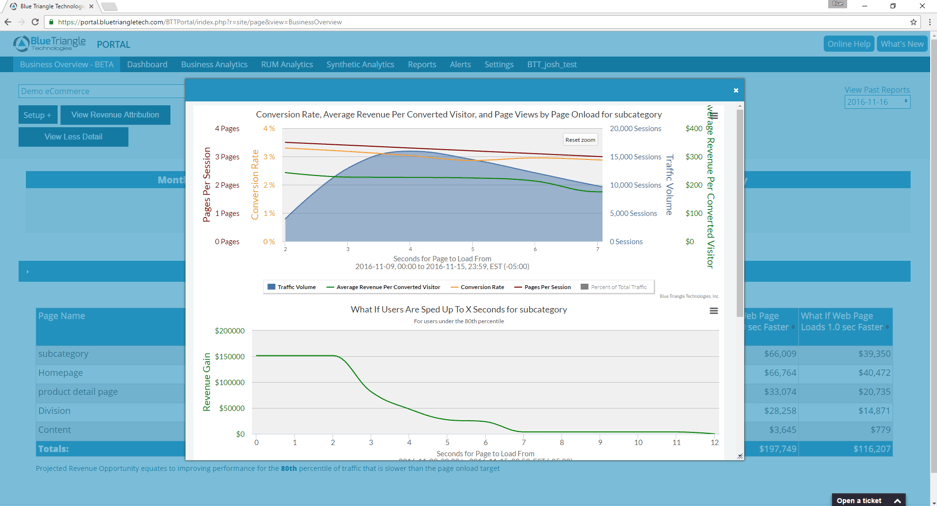
Between a 2-second and a 7-second experience on the Subcategory page:
- Conversion rates drop 12% (3.3% to 2.9%)
- Revenue per customer drops 28% ($243 to $175)
- Pages per session drops 14% (3.5 to 3)
Reveal the incremental revenue opportunities from performance we found earlier.
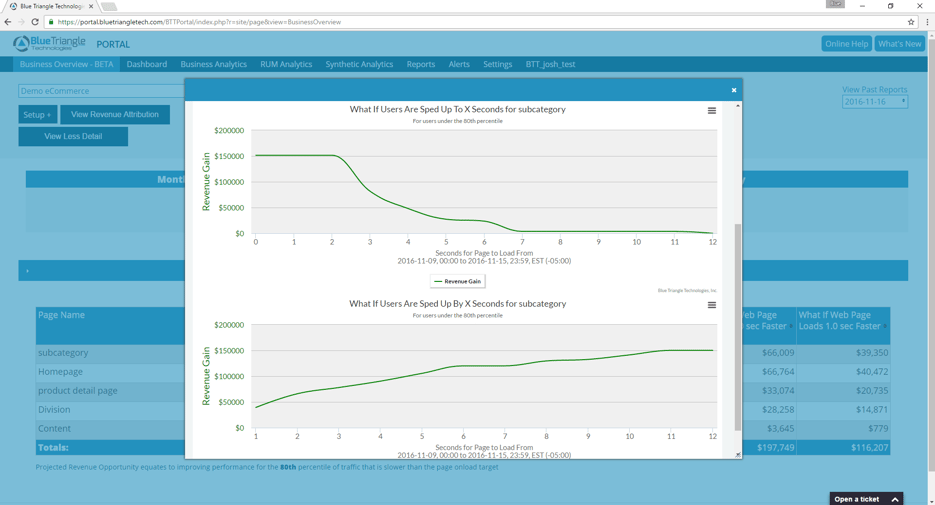
If the subcategory page speeds up to 3 seconds, the weekly revenue gains will be $82K. If the page speeds up by 3 seconds, the weekly revenue gains will be $78K.
Makes for a compelling business case to improve performance, doesn’t it?
You may be asking yourself, “Can this analysis separate out mobile and tablet as well?” Yes! We recommend that companies go into their Business Overview Setup and configure separate reports since mobile and tablet sites are usually (and should be) managed differently than desktop sites.
Find revenue opportunity for mobile and tablet experiences.
The report is now configured and updated to reflect just mobile and tablet revenue opportunity.
Did you notice that optimization priorities are different between devices? Guesswork eliminated.
| Desktop vs Mobile & Tablet Page Prioritization | ||
| Priority Level | Desktop | Mobile & Tablet |
|---|---|---|
| 1 | Homepage | Subcategory |
| 2 | Subcategory | Homepage |
| 3 | Product Detail Page | Division |
How does the predictive analysis work?
We have a small piece of JavaScript that collects the interactions of every customer on a given website – the speed of each page loaded, whether or not they bought, how much they spent, when and where they abandoned, etc.
Take a look at the graph below. This is the genesis of our predictive analysis.
If this site’s customers (shaded blue) receive a faster experience, the shaded portion will shift to the left, resulting in immediate conversion rate and revenue increases.
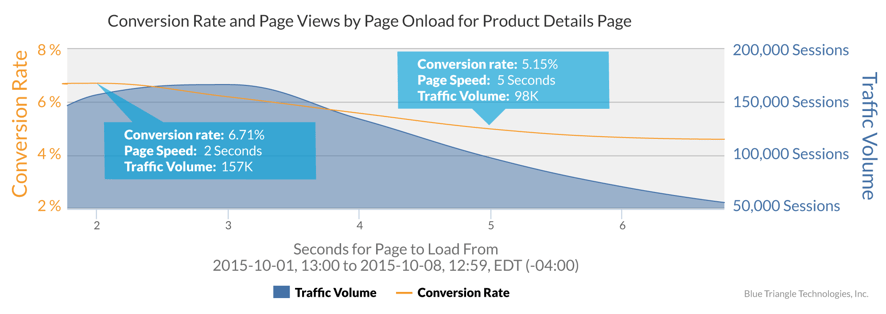
At a very basic level, this is how the predictions are made. However, there are many more factors taken into consideration (i.e. revenue per customer, traffic volume). After many years of development and billions of website interactions measured later, we have arrived at a perfected revenue predictive model; our forecasting is 85%+ accurate.
To see the Blue Triangle Business Overview in action, Schedule your demo with one of our experts today!
During the holiday rush, every shopper matters
Optimize the customer journey before the eCommerce event of the year.